
Economic inequality and opportunity loomed large in the 2016 presidential election. It’s not just that there’s a large and growing gulf between the very rich and very poor throughout the country. It’s that certain parts of the country, typically big cities located on the coasts, represent the lion’s share of economic growth and investment. And voting patterns indicate that this unequal geographic distribution of growth and new wealth creation may have affected how people cast their ballots.
Follow Crunchbase News on Twitter & Facebook
But does VC investment fall along similar lines? In other words, is it red states or blue states that account for most of the funds raised by startups from venture capitalists, seed funds, and angel investors? That’s what we’re going to attempt to answer today.
One State, Two State, Red State, Blue State
There are many ways to classify America’s states – and, indeed, individual Americans – by political leanings. Our efforts will be focused on the two major political parties and the colors that have come to represent each party over the past forty years. (If you’re interested in how the parties got their colors, the Washington Post’s Philip Bump published a good historical analysis of the subject on Election Day 2016.)
On one end of the spectrum, there are the Democrats, now typically identified with the color blue and their symbolic donkey. On the other, we have Republicans, branded with the color red and identified by their elephant logo.
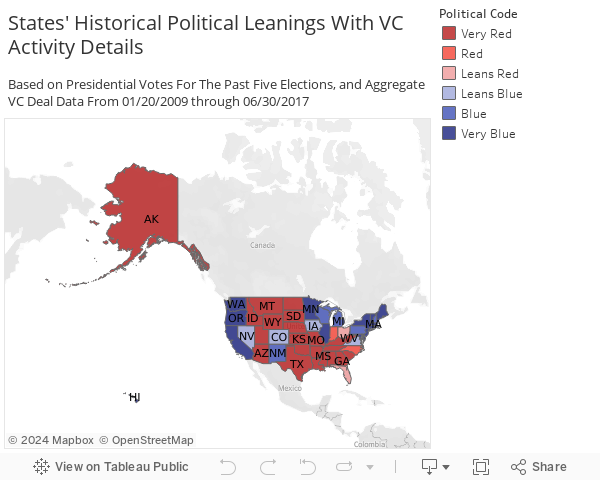
Here’s how the 50 states, plus the District of Columbia, fall along this version of the political spectrum. (To learn how we classified each state, see our methodology at the end of this article.)

In general, it’s a fairly even split, with just one more state on the Republican side of the proverbial aisle—at least based on voting patterns from the past five presidential elections.
But that’s where the equality ends.
The Geopolitics Of VC Activity
We’ll look at the total distribution of venture capital deals and dollar volume throughout the US’s 50 states, and the District of Columbia, from the beginning of former President Barack Obama’s first term through the end of Q2 2017, a little over five months of the Trump administration. We include the final period because the economy still has the head of steam built during the Obama administration after the Great Recession.
Based on these criteria, we’ve been able to extract nearly 69,200 deals struck with US-based companies between January 20, 2009 and June 30, 2017. Of these, there are funding amounts listed for nearly 56,500 of those deals. Going forward, be mindful of the distinction between “deal volume,” where we’ll discuss the distribution of the 69,200 deals, and “dollar volume,” based on the total funding amounts from a smaller number of deals.
So what does the deal and dollar volume data show us? According to the chart below, VC investment skews heavily in favor of startups based in historically blue states.

In some ways, this shouldn’t be a surprise to anyone. The top three states for startup funding, taken together, account for 69.7 percent of all the total VC dollar volume and 57 percent of the number of VC deals during the period we analyzed.
California, New York, and Massachusetts are firmly planted on the “very blue” side of the political spectrum (see methodology notes), having voted for Democratic candidates in each of the five presidential elections since 2000. In fact, all three states have voted for Democrats going back to the 1992 election.
If the gulf between red state and blue state startups’ fundraising activity was remarkable in the aggregate, the contrast becomes starker still when we analyze the last eight years on an annual basis.
The Red State-Blue State Funding Divide, Through Time
We’ve aggregated recorded deal data from Crunchbase (upon which the projections reported in Crunchbase’s annual and quarterly reports are based) and found that, between 2014 and the end of 2016, startups in blue states – again, led by the top three overall, which all happen to be blue – have raised the majority of the funds over time.

It’s also the case that blue state-based companies account for the majority of individual funding rounds counted in our dataset, as we can see below.

However, in both the case of deal and dollar volume, year-to-year fluctuations are generally in the same direction. In general, year-to-year growth rates (be they positive or negative) appear to be highly correlated, although these shifts are somewhat more volatile in the case of dollar volume. In other words, companies in red states and blue states tend to enjoy roughly the same proportion of each year’s respective dollar and deal-making pies.
This year-to-year consistency is especially apparent in the proportional share of deal volume over time.

The chart above shows just how static the market has really been over the past eight or so years. Blue states unfailingly account for around 80 percent of deals every year, plus or minus one or two percent.
The chart displaying the proportional share of dollar volume over time is remarkably similar.

Apart from slightly more year-to-year variance, in the two to three percent range overall, red and blue states’ share of VC dollar volume remained fairly stable over the past eight and a half years.
There might be an advantage, on an absolute basis, for companies based in blue states – particularly if they reside in one of the top three – because there are more deals closed and dollars. However, on a relative basis, it doesn’t really matter, because the number of deals closed or the amount of money raised in blue states has not grown any faster, on average, than in more conservative-leaning counterparts.
In Blue Vs. Red, Which States Top The Charts?
Politics aside, venture capital activity is unequally distributed throughout the US, with just a few states accounting for the majority of capital invested and deals struck. But which states are the ones responsible for most of the deal and dollar volume over the past eight and a half years? Which are the most active red states and blue states for startup funding activity? That’s what we’ll find out here by ranking the amount of VC activity occurring in the top five red and blue states.
In the blue corner, it should come as no surprise what at least three of the top states are. Here’s the ranking.

As we’ve established before, California, New York, and Massachusetts are the reigning champions of startup funding activity in deal and dollar volume. This is true for the “Obama Era” we analyzed here and even further back in history. Washington state is in a respectable fourth place overall, and Illinois and Pennsylvania rounded out the top five states in each category.
And as for the red corner, well, we’ve got a lot of perfectly good welterweights facing off against a number of super-heavyweight opponents. It’s not a fair fight, so to speak.

Coming in at just 3.4 percent of the dollar volume and 4.6 percent of the total number of deals during the Obama Era, Texas leads the pack for red states. Austin—which Crunchbase News found to be the biggest startup hub in the Lonestar State—Dallas, and Houston lead the state in both deal and dollar volume. Florida comes in second, no doubt bolstered by the likes of Magic Leap’s $1.4 billion in funding, as well as a number of science and engineering oriented companies on the Space Coast. Georgia, placing in third, is the only other Republican-leaning state that places on both rankings of startup funding activity.
The Political Map of Startup Funding
Today, we’ve learned that the breakdown of red states versus blue states is fairly equal; however, the distribution of startup funding is anything but. To be sure, venture capital activity is not likely to be a major wedge issue for most voters. Accordingly, it’s unlikely that VC dealmaking bears a direct, causal relationship to how voters vote in a particular state.
But what we have shown is this: venture capital investment serves as another strong indicator that points to entrenched economic inequality in the US on a geographic level. This might lend some credence to assertions that the so-called “coastal elite” live in a kind of parallel economy, out of touch with the rest of America. At least by this measure, that might be true.
It’s a lot of information to take in, so here’s an interactive map for you to explore. (We recommend clicking the Full Screen button in the bottom right corner of the chart. If you’re having trouble viewing, here’s a direct link to the interactive map.)
Methodology
How We Classified Red And Blue States
As stated before, a mere snapshot of one election – especially one as divisive as 2016’s – is insufficient to capture the breadth of the political spectrum. To derive a first-order approximation of that spectrum since recent memory, we’re going to look at the state-by-state results for the past five elections: 2000, 2004, 2008, 2012, and 2016.
We’ll look at popular vote totals for the sake of internal consistency because how states divide electoral college votes isn’t consistent. Almost all states – 48 of them, plus the District of Columbia – allocate those votes by a “winner take all” scheme, whereas two – Maine and Nebraska – allocate them based on a proportional share of the popular vote.
Our definition of red and blue States are as follows:
- Very red. Republicans received more votes in 5 of 5 elections
- Red. Republicans received more votes in 4 of 5 elections
- Leans red. Republicans received more votes in 3 of 5 elections
- Leans blue. Democrats received more votes in 3 of 5 elections
- Blue. Democrats received more votes in 4 of 5 elections
- Very blue. Democrats received more votes in 5 of 5 elections
Data We Used
As far as the data go, we’re painting with a very wide brush. The dataset we used here is industry-agnostic, and it accounts for a number of private market equity funding round types, including earlier-stage rounds in the “Seed,” “Angel,” and “Convertible Note” categories. We also included rounds Crunchbase classifies as “Venture” rounds, starting at Series A and onward. Notably, we’ve excluded funding rounds labeled “Private Equity” in Crunchbase’s data, as well as non-equity funding rounds like debt financings, grants, and the like.
iStockPhoto / Stevegraham

Stay up to date with recent funding rounds, acquisitions, and more with the Crunchbase Daily.

![Illustration of stopwatch - AI [Dom Guzman]](https://news.crunchbase.com/wp-content/uploads/Halftime-AI-1-300x168.jpg)


67.1K Followers